https://www.jpl.nasa.gov/news/news.php?feature=6584Páginas

15/9/10

Arctic Dispatch: A Thaw in the Arctic Tundra


Researchers at the Toolik Field Station study thermokarst to understand the ecological effects of climate change

  • By Christine Dell’Amore
  • Smithsonian.com, July 22, 2008


Read more:  
 
Knee-deep in the muddy shambles of collapsed Alaskan tundra, Elissa Schuett points to the remains of a cavern that she was able stand in last summer. Today, it is gone, gobbled up by the gaping maw known as a a thermokarst that continues to march outward as the land rapidly melts.
Thermokarst failures occur when permafrost—a layer of frozen soil in Earth's polar regions—thaws and becomes unstable. Though the events occur naturally throughout the Arctic, many scientists suspect that rising temperatures in the north are causing more of these features to form. By comparing aerial photographs from 1985 with recent photos, "We can now say with some assurance... that in some locations [there are] between two and five times more of these features now than in the early 1980s," says William Bowden, an aquatic ecologist at the University of Vermont.
That's why Bowden, his research assistant Schuett, and others at Toolik Field Station, a University of Alaska, Fairbanks, research facility 150 miles north of the Arctic Circle in northern Alaska, are studying the impact of thermokarsts on the environment. Their work fits into a long tradition of climate change research at Toolik, which, since its founding in 1975, has provided a pristine laboratory for studying how a warmer world will transform the land and waterways of the Arctic.
Understanding climate and environmental change, according to Norman Marcotte of Canada's Natural Sciences and Engineering Research Council, is the "burning issue" in Arctic research internationally. Research stations such as Toolik are key in capturing long-term data and exploring issues in the field, he says by e-mail, and Canada has plans to develop an Arctic research station with many of the same elements as Toolik.
Though much of Arctic research has focused on observing the environment, "At Toolik we're able to go deeper into that" and "study what's actually controlling all these processes," says Toolik co-founder John Hobbie, a senior scholar at the Ecosystems Center of the Marine Biological Laboratory in Woods Hole, Massachusetts.
It's also "the only place in North America where we can see or get an advanced view of how climate change can affect ecosystems," he adds.
And in many ways, climate change has already begun reshaping this dichotomously fragile and hardy land. Between 1966 and 1995, Arctic temperatures increased .7 degrees Celsius per decade, a trend that puts "northern Alaska in the hot seat," says Syndonia Bret-Harte, Toolik's associate science director. The Arctic is warming faster than even the tropical areas of the world: Spring arrives earlier, fall sets in later, and the temperature of the permafrost in many areas, including Toolik, hovers perilously close to the zero-degree Celsius tipping point. That's when the frozen soil that gives the tundra its backbone could crumble away.

New thermokarsts in
Alaska could also show how warming may change streams or lakes, since these features often occur near water. When a thermokarst was discovered in 2003 near the Toolik River, Bowden and colleagues found it had dislodged so much sediment into the river that the water turned muddy 40 kilometers downstream. He and his colleagues also reported in June 2008 in the Journal of Geophysical Researchthat ammonium, nitrate, and phosphorus emitted from that collapse will over time "significantly alter the structure and function of the river."
For Bowden and other Toolik researchers, such observations were familiar. Between 1983 and 2004, they saw how drastically phosphorus could restructure a river in an experiment done on the Kuparuk River near Toolik—"the best studied river basin in the whole Arctic," according to Hobbie. In that experiment, scientists added small amounts of phosphorus, a nutrient common in fertilizer and residential and industrial pollution, to the river each summer. After eight years, moss expanded in the river, crowding out other plant species and sparking a growth in certain types of insects. Productivity overall in the river boomed. This investigation may foreshadow what happens when permafrost melts and nutrients are freed into the air and water.
On land, Toolik researchers have also added fertilizer to different types of tundra. In an experiment operating since 1989, Ecosystems Center senior scientist Gaius Shaver has found that on tussock tundra, some deciduous shrubs, such as dwarf birch, can capitalize on the influx of nitrogen and phosphorus by increasing in abundance and reducing species diversity. Toolik scientists are also focused on why the Arctic seems to be greening, Bret-Harte explains. It may be due to more shrubs: About 12,000 years ago when the climate was warmer, shrubs dominated the landscape, she said.
Though these polar shifts may seem isolated from the rest of the world, a melting Arctic could accelerate climate change. Bret-Harte points out that Arctic landmasses—including the boreal forests—hold nearly 40 percent of the world's soil carbon, but make up only one-sixth of Earth's land area. If the carbon locked up in the soil is released by melting permafrost, she says, it could more than double the concentration of carbon dioxide , a major greenhouse gas, in the environment .
Bowden of the University of Vermont believes there is "strong evidence" that trapped carbon and methane could be set free during thermokarst events and contribute to warming. He is seeking funding to investigate how thermokarsts will influence Arctic ecosystems overall. For instance, a thermokarst that causes a spike in sediments in waterways may suffocate plants, clog fish gills, and ultimately set off a cascade of effects all the way up the food web.
"It's not a horror story—it's not like this is not a natural process," Bowden cautions. "But I think there's strong evidence that [human] influences that are some distance away from Arctic are having these secondary effects... which are going to be potentially very important in structuring the way the Arctic landscape looks and behaves in the future."


Read more:


SELAWIK: Alaska’s Largest River Thaw Slump Still Eroding


El testero de la caída de torres Selawik 70 pies de altura, cayendo constantemente deshielo de sedimentos a la planta baja. Julio de 2010. Foto de Georgina Susan.
Fish and Wild Life Journal
Un gran "bajón" deshielo del permafrost creadas por el fracaso ocurrido en el curso superior del río en el noroeste de Alaska Selawik en 2004. Desde entonces, la caída estacional ha transformado el claro río una vez en un turbio (barro) uno de muchos kilómetros aguas abajo. El más grande de su tipo en Alaska, la caída ha atraído la atención de los geólogos, hidrólogos, biólogos pesqueros, y otros científicos interesados en comprender la dinámica y los impactos de este evento.
En julio, el personal Selawik Refugio acompañó a dos geólogos en investigaciones de campo de la depresión. Por tercer año, el Dr. Benjamin Crosby de Idaho State University seguido documentando los tipos y los mecanismos de crecimiento caída, el carácter de los sedimentos liberados en el río y sus efectos en la función del río, y la posibilidad de características similares en el drenaje. El Dr. Joel Rowland de Los Alamos National Lab iniciado estudios sobre la erosión del Ártico orilla del río y la movilidad de los ríos y en el modelado de fallas landsurface. La caída, sobre todo su testero, sigue activa y ampliar deshielo.
El acceso a la caída de deshielo no es fácil. Un hidroavión cayó fuera de la tripulación de la investigación sobre un lago de la tundra, donde porteábamos sus artes a la orilla del río, montado "doblar" las canoas, y nadó 25 millas en dos días a la caída. Después de 2-3 días de investigaciones sobre el terreno, la tripulación canoed otros 25 kilómetros, deteniéndose en el camino en los sitios de investigación adicional, a continuación, desmontar las embarcaciones y los artes de porteábamos a otro lago tundra de un hidroavión pick-up.
En los últimos 50 años, Alaska se ha calentado a más del doble la tasa del resto de la media de los Estados Unidos. Estas altas temperaturas contribuyen a calentamiento del permafrost, que pueden crear cambios dramáticos en la estabilidad de laderas como de dinámica de los ríos. La caída Selawik deshielo del río presenta una oportunidad poco usual para el estudio de este precursor del cambio climático. La investigación sobre la caída se espera que continúe durante muchos años en el futuro.

10/9/10

End of summer approaches for Arctic sea ice

Figure 1. Arctic sea ice extent for August 2010 was 5.98 million square kilometers (2.31 million square miles). The magenta line shows the 1979 to 2000 median extent for that month. The black cross indicates the geographic North Pole. Sea Ice Index data. About the data.  

National Snow and Ice Data Center
Arctic sea ice generally reaches its annual minimum extent in mid-September. This August, ice extent was the second lowest in the satellite record, after 2007. On September 3, ice extent dropped below the seasonal minimum for 2009 to become the third lowest in the satellite record.
The Northwest Passage and the Northern Sea Route are largely free of ice, allowing the potential for a circumnavigation of the Arctic Ocean. At least two expeditions are attempting this feat, the Norwegian explorer Borge Ousland and the Peter I yacht from Russia.
Overview of conditions
Average ice extent for August was 5.98 million square kilometers (2.31 million square miles), 1.69 million square kilometers (653,000 square miles) below the 1979 to 2000 average, but 620,000 square kilometers (240,000 square miles) above the average for August 2007, the lowest August in the satellite record. Ice extent remained below the 1979 to 2000 average everywhere except in the East Greenland Sea near Svalbard.
The minimum ice extent for the year will probably occur in the next two weeks. NSIDC scientists are closely monitoring conditions and will report the minimum when it occurs. 
Figure 2. The graph above shows daily Arctic sea ice extent as of September 6, 2010, along with daily ice extents for years wtih the four lowest minimum extents. The solid light blue line indicates 2010; orange shows 2009, pink shows 2008; dashed green shows 2007; light green shows 2005; and solid gray indicates average extent from 1979 to 2000. The gray area around the average line shows the two standard deviation range of the data. Sea Ice Index data.
—Credit: National Snow and Ice Data Center


Conditions in context
At the end of August, ice extent had fallen to the fourth lowest in the satellite record, behind the seasonal minima recorded for 2007, 2008, and 2009. On September 3, ice extent fell below the seasonal minimum for 2009 to claim third lowest on record, with perhaps one to two weeks left in the melt season.
The daily rate of decline for August was 55,000 square kilometers (21,000 square miles) per day, close to the 1979 to 2000 average of 54,000 square kilometers (21,000 square miles).

Figure 3. Monthly August ice extent for 1979 to 2010 shows a decline of 8.9% per decade.
—Credit: National Snow and Ice Data Center August 2010 compared to past years
Ice extent for August 2010 was the second lowest in the satellite record for the month. The linear rate of decline of August ice extent over the period 1979 to 2010 is now 8.9% per decade.


Figure 4. This map of sea level pressure for August 2010 shows a return of the dipole anomaly, which was present in June but not in July.
—Credit: NSIDC courtesy NOAA/ESRL PSD

Return of the dipole anomaly
In August, a pattern of higher than average pressure over the northern Beaufort Sea and lower than average pressure over the Siberian side of the Arctic replaced the stormy and cool weather conditions that persisted through July. This atmospheric pattern, known as the dipole anomaly, brought relatively warm southerly winds into the Beaufort and Chukchi seas, where air temperatures were 1 to 3 degrees Celsius (1.8 to 5.4 degrees Fahrenheit) above normal for the month of August. The warmth enhanced melt in the region, and southerly winds contributed to ice loss by pushing the ice edge northward. This pattern is similar to the pattern at the end of the 2007 melt season, but not as pronounced. Air temperatures this August were also 1 to 3 degrees Celsius (1.8 to 5.4 degrees Fahrenheit) below normal over the Barents and Kara Seas.
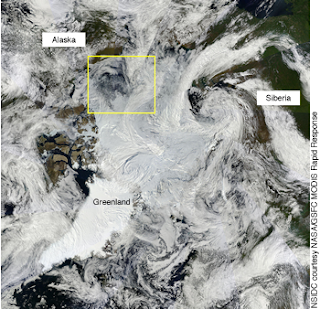
Figure 5. This image from NASA's MODIS sensor on the Aqua satellite on August 25, 2010, shows open water and low-concentration ice in the Beaufort Sea, the region where large amounts of rotten ice were observed last year.
—Credit: National Snow and Ice Data Center courtesy NASA/GSFC MODIS Rapid Response


Rotten ice in the Beaufort and Chukchi seas
Last year, Dave Barber, a researcher from the University of Manitoba, reported unusual conditions in the Beaufort Sea with large regions of rotten ice. Satellite imagery from the NASA Moderate Resolution Imaging Spectroradiometer (MODIS) and Advanced Microwave Scanning Radiometer - Earth Observing System (AMSR-E) sensors suggest similar conditions this year in the Beaufort and Chukchi seas, where there are large areas with unconsolidated ice floes and low ice concentration.

 Figure 6. This graph of regional ice loss in the Arctic shows faster than normal ice loss in the Beaufort and Chukchi seas, and slower than normal ice loss in the East Siberian Sea and Central Arctic. The map in the bottom left corresponds to the regions plotted across the top of the graph. Colors in the bar graph correspond to August ice loss in different years.
—Credit: National Snow and Ice Data Center
High-resolution image

Regional ice loss
The rate of ice loss in the summer varies from region to region depending on local air and ocean temperatures and wind patterns. This August, the decline in ice extent was unusually fast in the Beaufort and Chukchi Sea, likely because of the rotten ice that melted out completely. In addition, southerly winds linked to the dipole anomaly pattern brought warmer air into the region and helped push the ice edge northward.
However, the loss rate in the East Siberian Sea and the Central Arctic was slower than any of the past three years, and was also fairly slow (slower than the 1979 to 2000 average rate) in the Laptev and Kara Seas. The reason for slow ice loss in the Kara Sea, however, is that there was already very little ice in that region at the beginning of August. Such year-to-year variations demonstrate the importance of weather conditions in determining regional ice loss.

Figure 3. Monthly August ice extent for 1979 to 2010 shows a decline of 8.9% per decade.
—Credit: National Snow and Ice Data Center 
Figure 5. This image from NASA's MODIS sensor on the Aqua satellite on August 25, 2010, shows open water and low-concentration ice in the Beaufort Sea, the region where large amounts of rotten ice were observed last year.
—Credit: National Snow and Ice Data Center courtesy NASA/GSFC MODIS Rapid Response


Regional ice loss
The rate of ice loss in the summer varies from region to region depending on local air and ocean temperatures and wind patterns. This August, the decline in ice extent was unusually fast in the Beaufort and Chukchi Sea, likely because of the rotten ice that melted out completely. In addition, southerly winds linked to the dipole anomaly pattern brought warmer air into the region and helped push the ice edge northward.
However, the loss rate in the East Siberian Sea and the Central Arctic was slower than any of the past three years, and was also fairly slow (slower than the 1979 to 2000 average rate) in the Laptev and Kara Seas. The reason for slow ice loss in the Kara Sea, however, is that there was already very little ice in that region at the beginning of August. Such year-to-year variations demonstrate the importance of weather conditions in determining regional ice loss. 

Figure 6. This graph of regional ice loss in the Arctic shows faster than normal ice loss in the Beaufort and Chukchi seas, and slower than normal ice loss in the East Siberian Sea and Central Arctic. The map in the bottom left corresponds to the regions plotted across the top of the graph. Colors in the bar graph correspond to August ice loss in different years.
—Credit: National Snow and Ice Data Center
High-resolution image
Further Reading
Barber, D. G., Galley, R., Asplin, M. G., De Abreau, R., K. A. Warner, M. Pucko, M. Gupta, S. Prinsenberg, and S. Julien, 2009: Perennial pack ice in the southern Beaufort Sea was not as it appeared in the summer of 2009, Geophysical Research Letters, 36, L24501, doi:10.1029/2009GL041434.

For previous analyses, please see the drop-down menu under Archives in the right navigation at the top of this page.

NASA logoNSIDC scientists provide Arctic Sea Ice News & Analysis, with partial support from NASA.